Visualisation
CliMA-specific tools
Julia and Python scripts and notebooks
- Bash scripts: end to end run-analysis pipeline
- VizCLIMA
- Plotly scripts
- Remote access of notebooks
DataVis project
As part of DataVis, Caltech has partnered with JPL and the ArtCenter College of Design to bring together software engineers and artists to build an interactive data visualisation tool, consulted by and build exclusively for CliMA’s scientists and developers (code, please contact me or a CliMA member for access).
Third party interactive software packages
- There are various third party packages that enable instant 3D interactive visualisation, slicing and animations of our data (NetCDF format by default), as well as conversion to other data formats. Examples include:
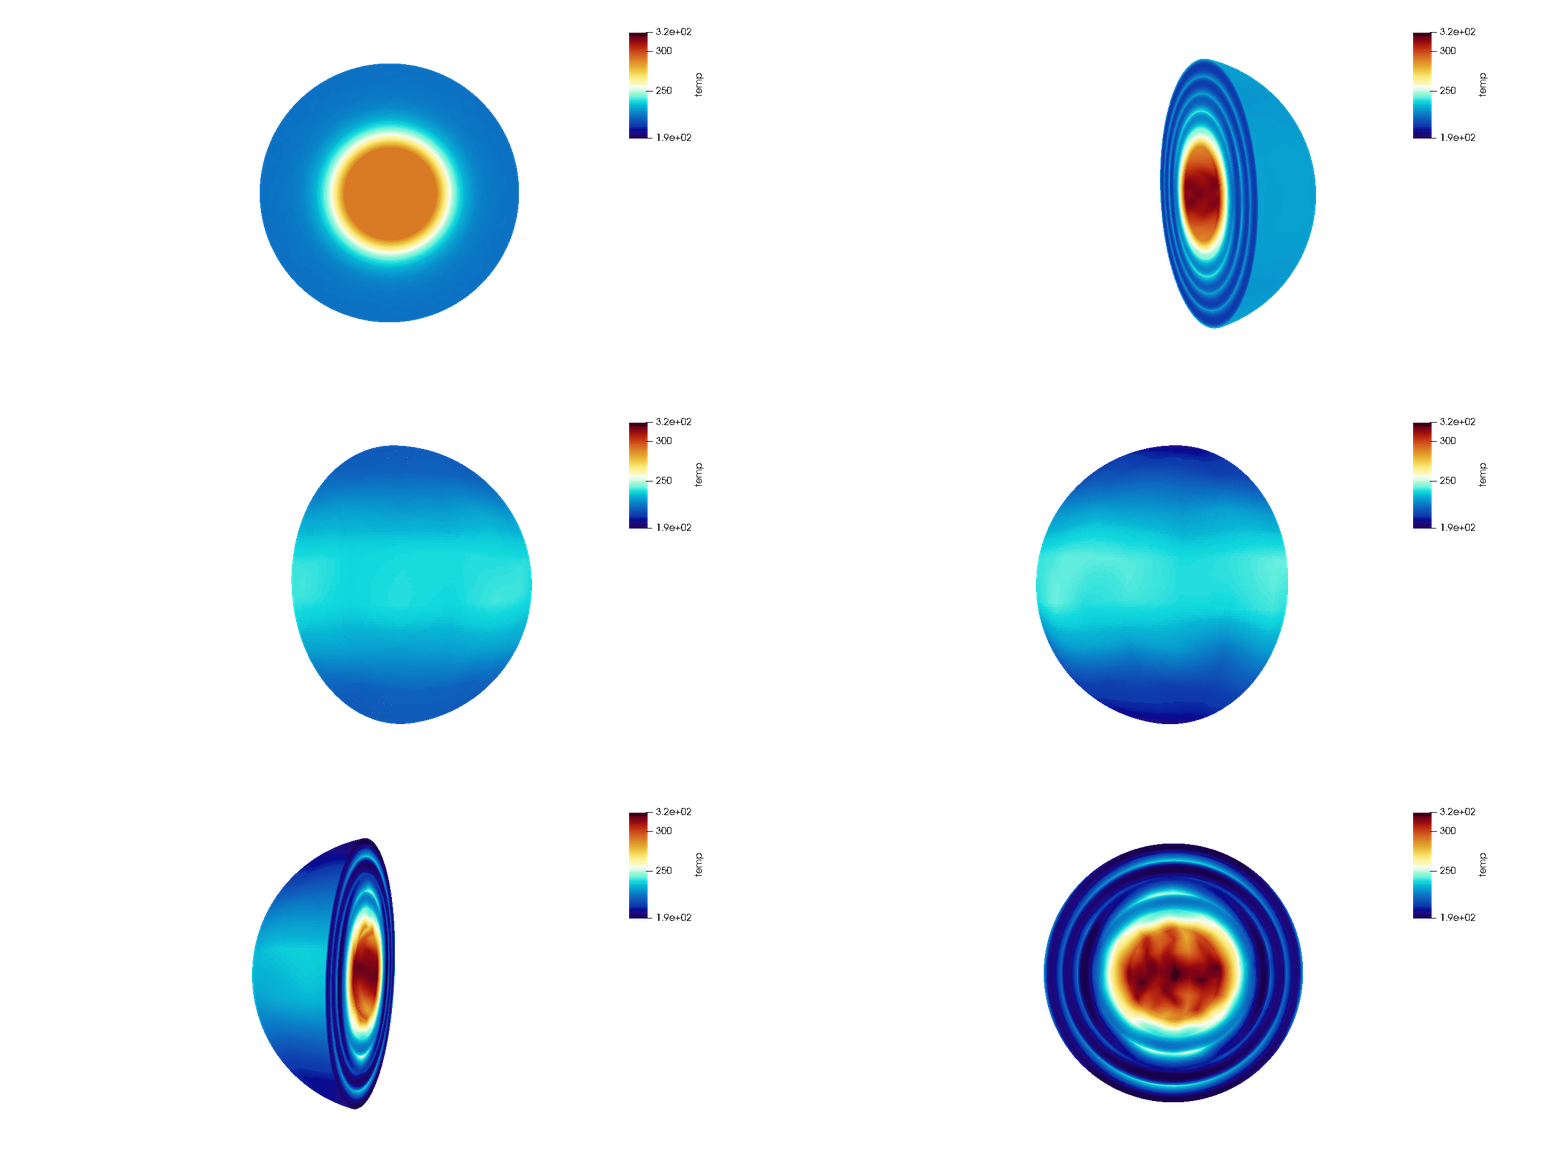
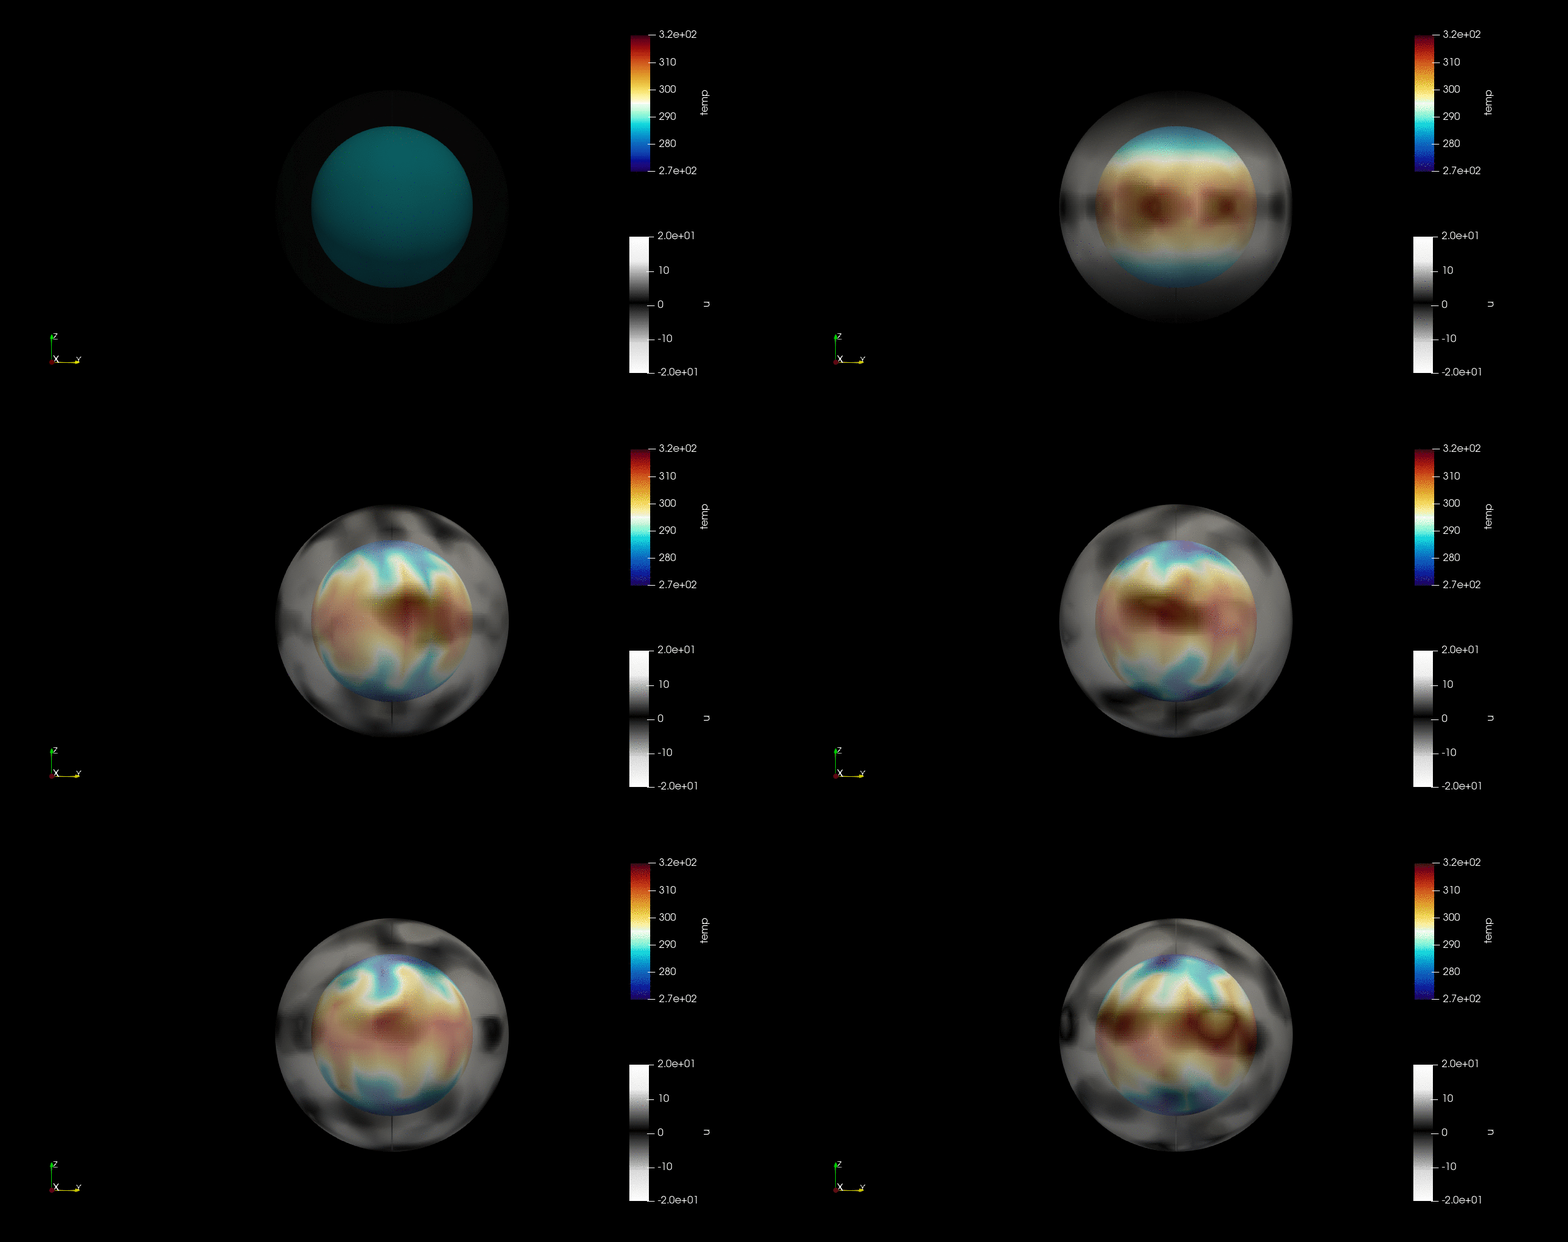
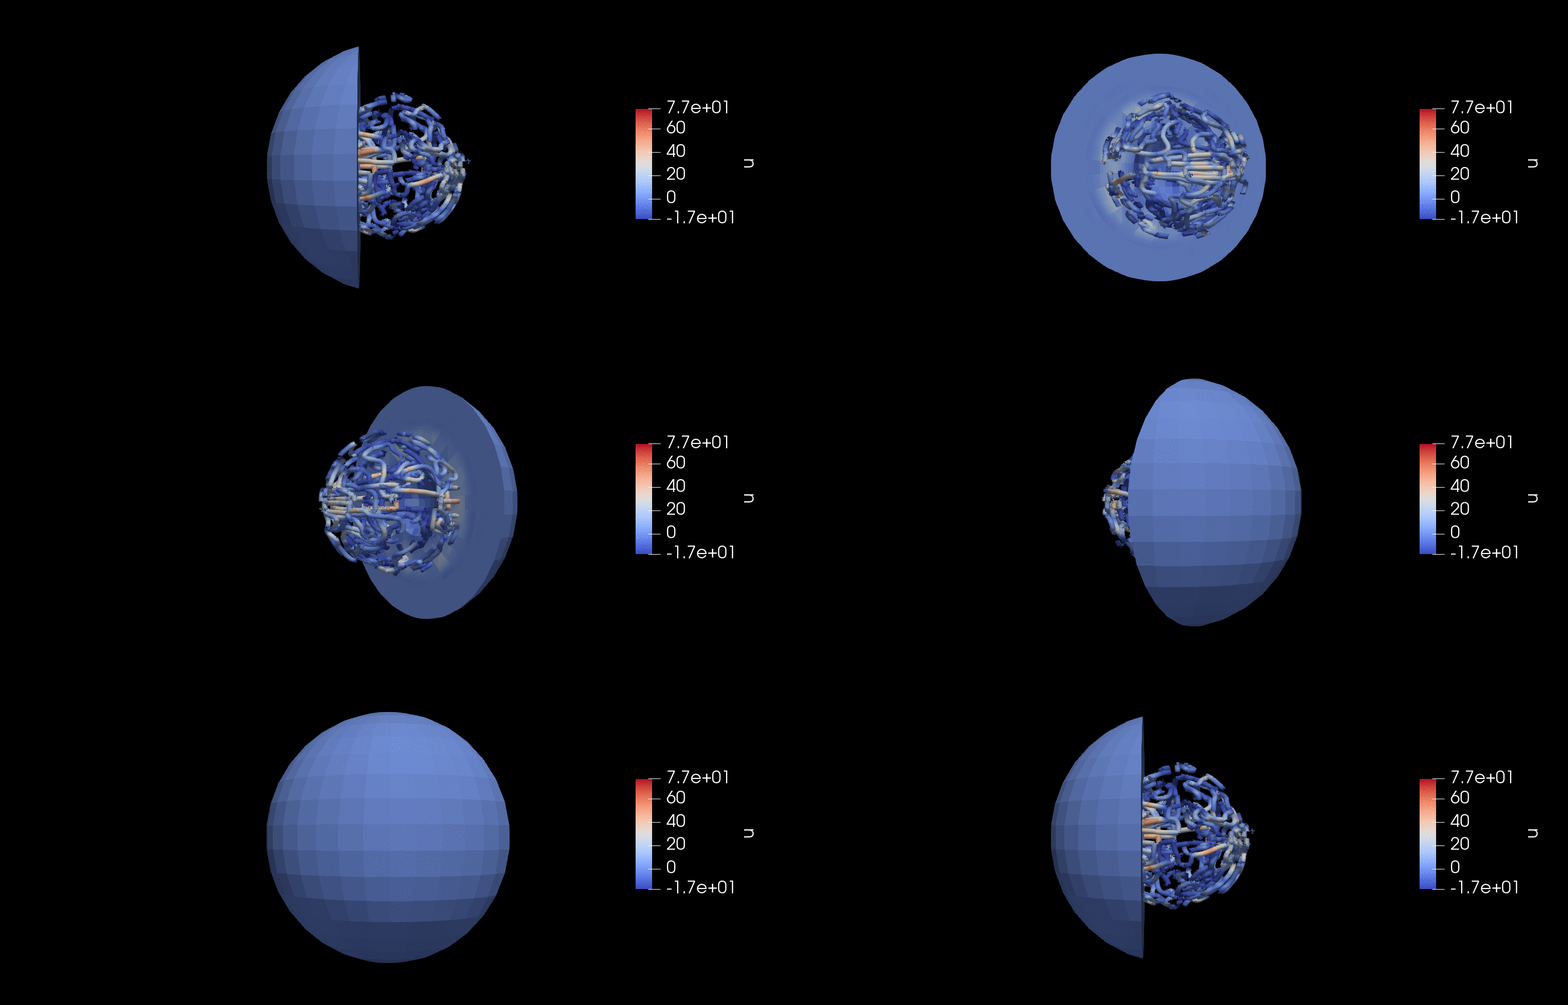
- ParaView: 3D visualisation, slicing and simple data manipulation, handles VTK files and can convert data to CSV and other formats.
- VisIt: similar to ParaView
- Panoply: summarises geospatial information of the global geospatial data
- Ncview: useful for a quick check of geospatial data on the Caltech cluster. It can handle large data files more easily than most other packages.
- Houdini: useful for more sophisticated representation of 3D turbulence and powerful data interpolation. Used by our Hollywood colleagues for CGI.
Examples from ParaView: Dry Held-Suarez spinup using ClimateMachine.jl (v0.1.0)


